Loom
August, 2015
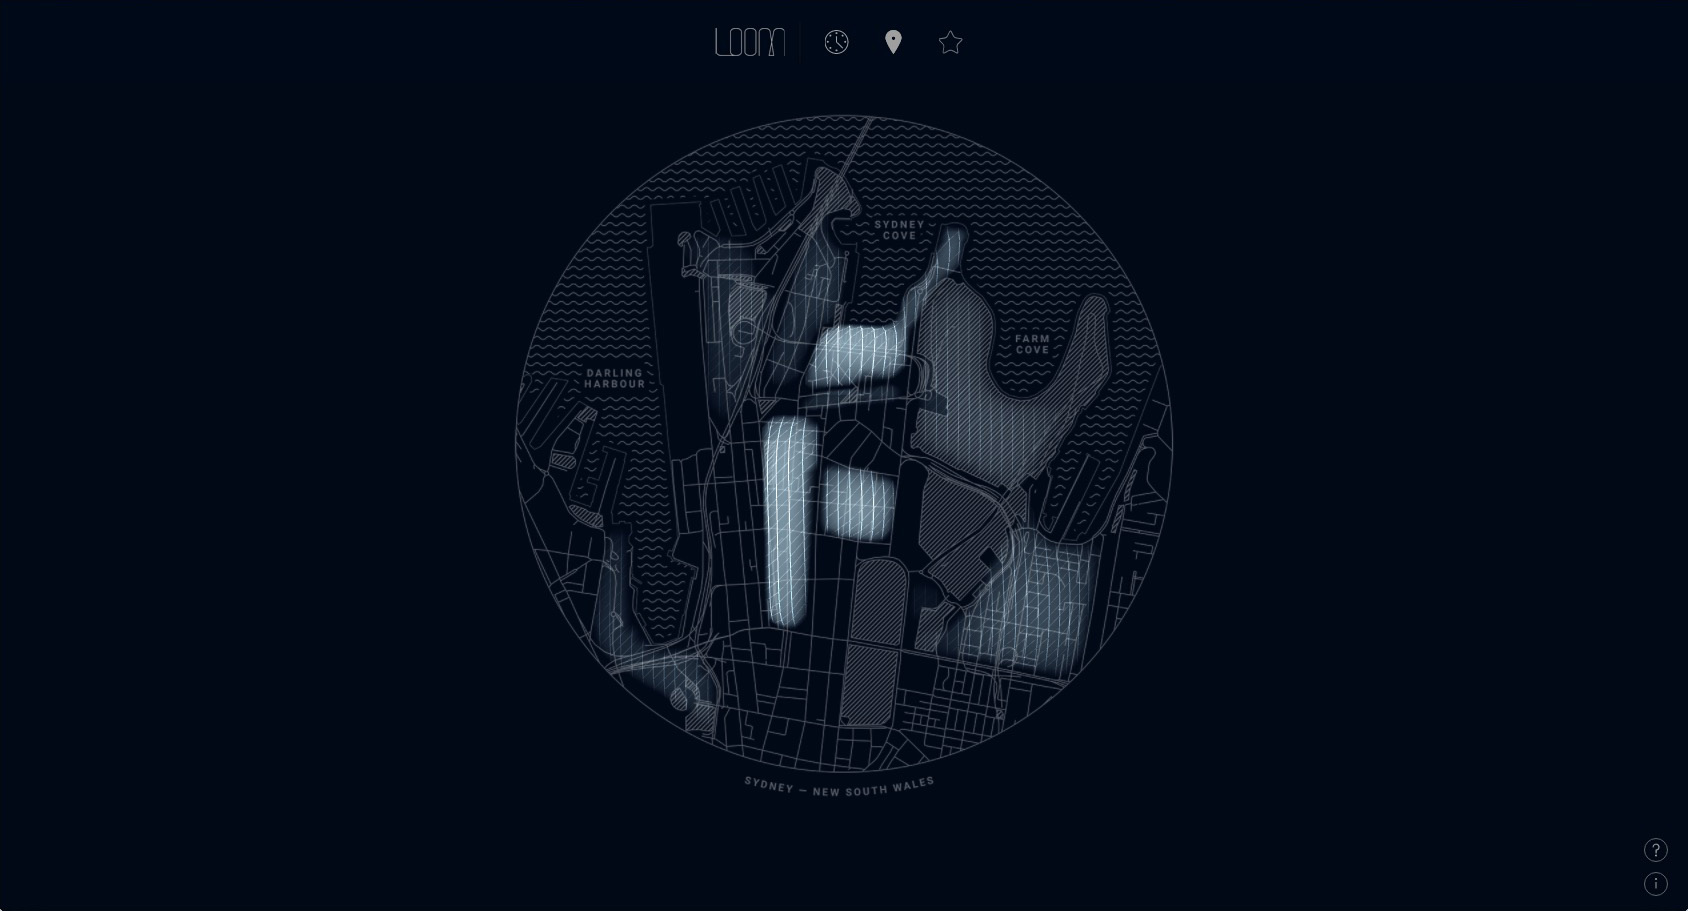
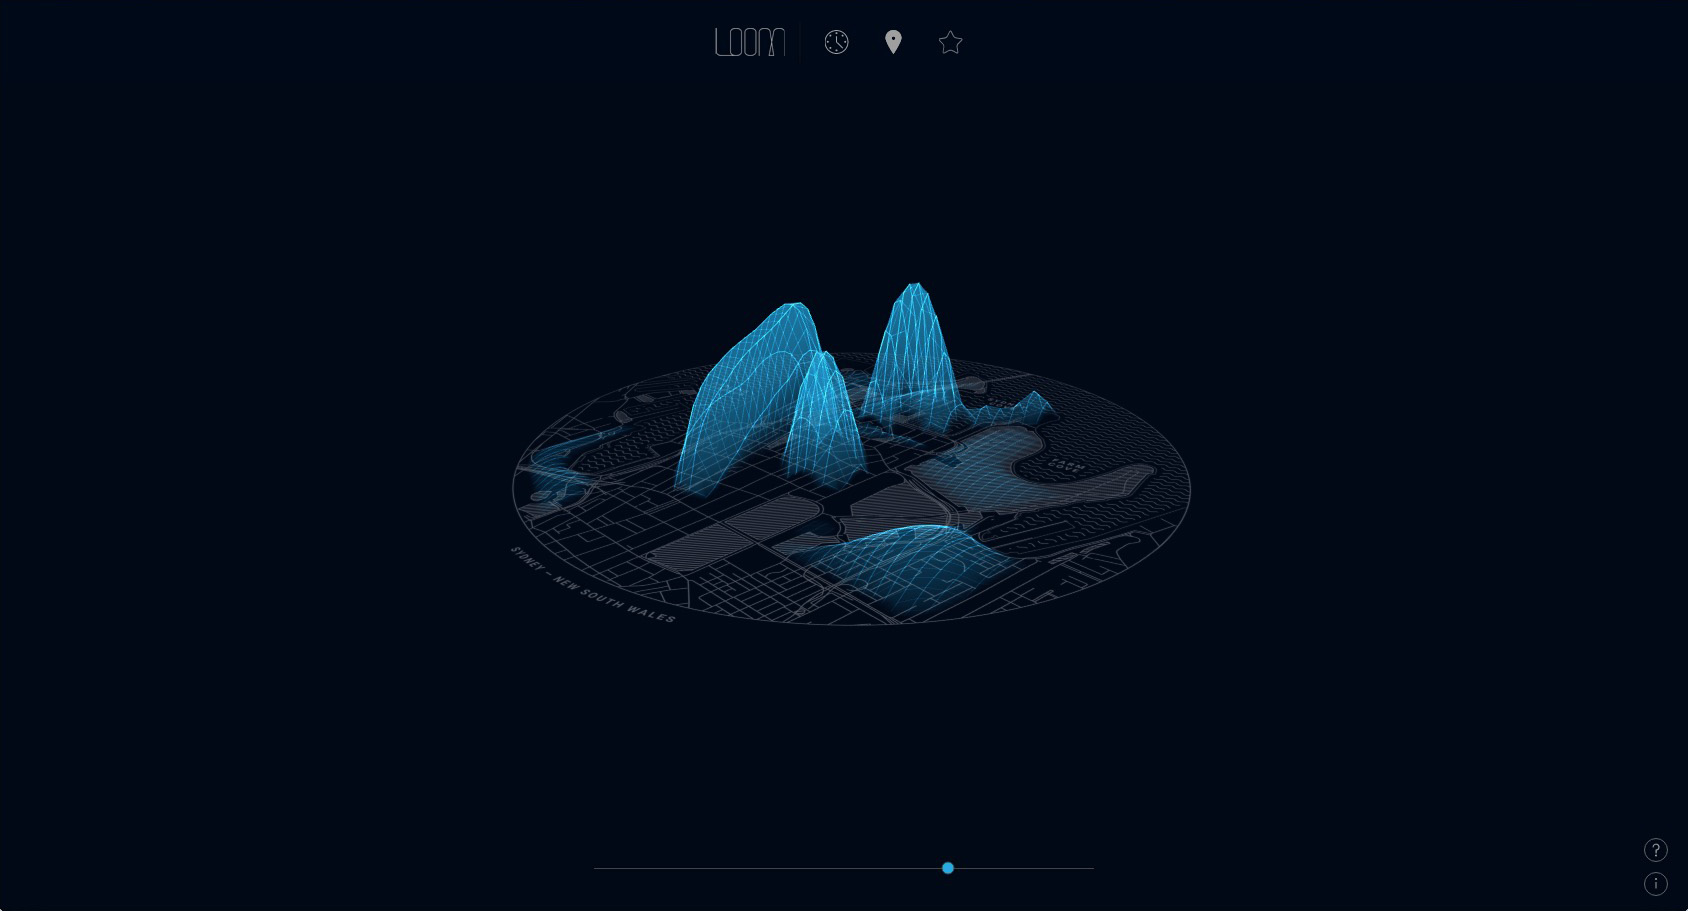
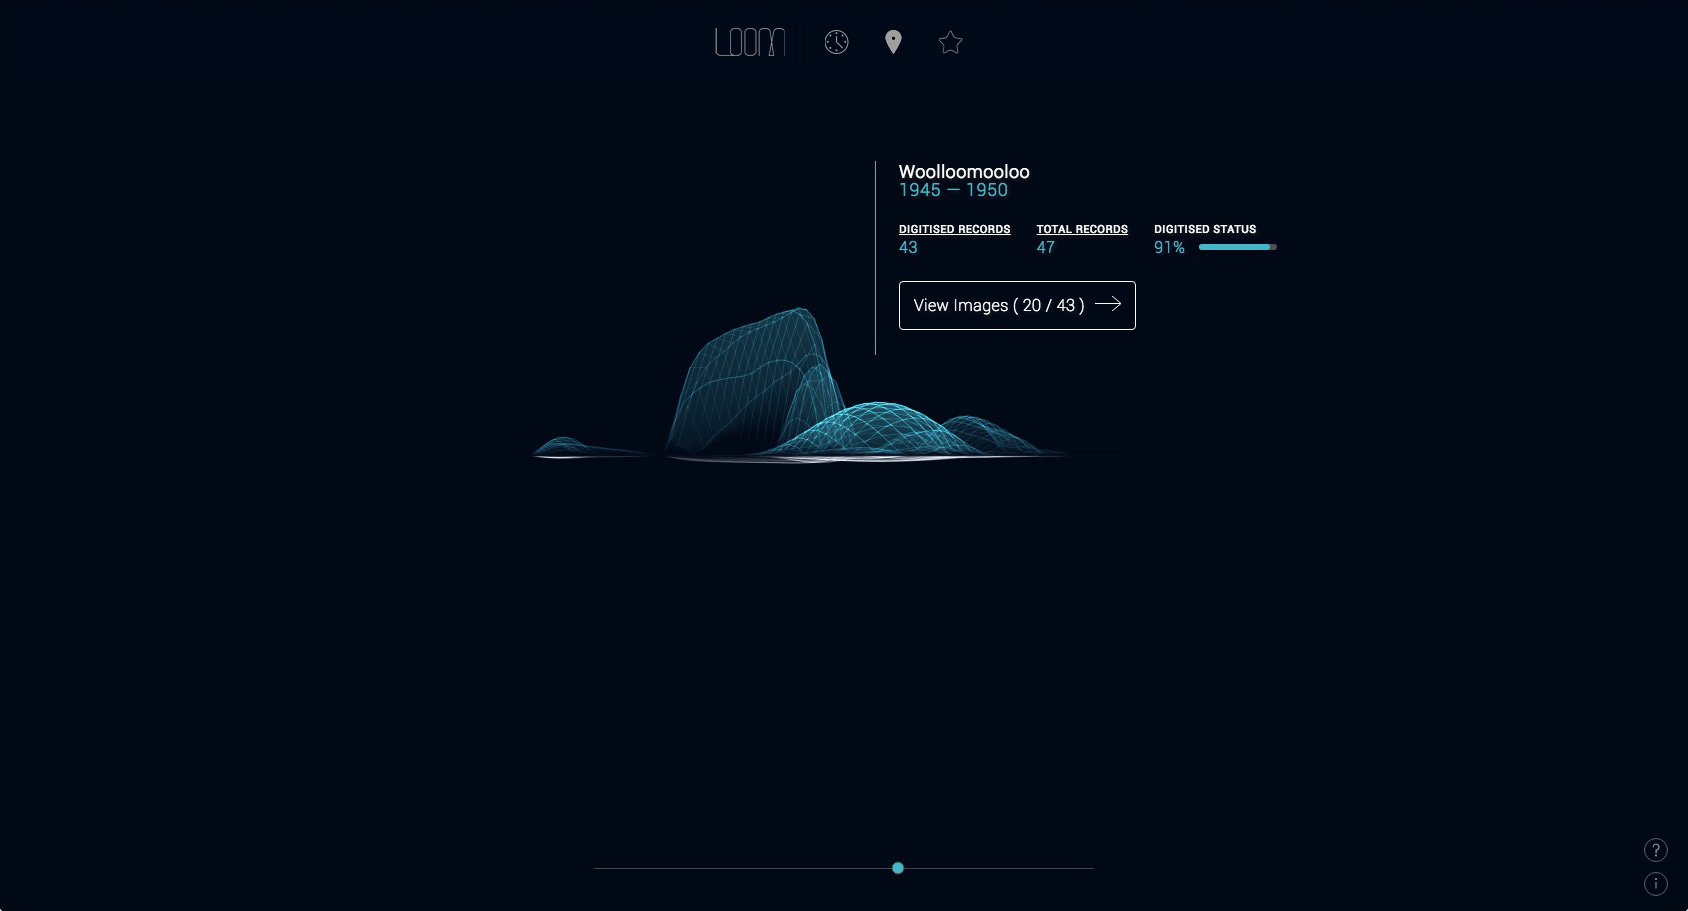
Loom is an innovative data visualization experiment that utilizes State Library's digital archive to showcase the evolution of Sydney's Central Business District from 1870 to 2000. The project employs three distinct visualization techniques to represent the data: a time-series chart that highlights changes over the decades, a map that displays the location-based information, and a tag-based system that connects related data points. These visualizations offer a unique perspective on the city's history and allow users to explore and interact with the data in engaging ways.
Related links
Role
Frontend DeveloperBackend Developer
Company

TriceratopsNGA - LaunchpadACMI - EEDOddity - Project C137TD01Grumpy Sailor WebsitePixi Trailing TextureGame OnProto Threejs ShaderCircles 1MODProto Pixi AnimatedSpriteThe CurrentRoad to ZeroGS OctopusAustralian Music VaultIO Internet PrototypesStory Spheres v2Pixel WallTalks at GoogleCanvas HexGhosts, Toast and the Things UnsaidGS LogoSL NSW Sydney MapThreeJs Shader MaterialFuture NatureLoomSL NSW ImagesStory SpheresRemember MeWebGL LinesPathsDrops 2Drops 1Red Ape WebsiteTribal Worldwide FlagsThis is nowThe WordFall in luxuryCaddy LifeGo Miniman GoThe Hanging Test DummyReality Advertising